From time to time, I stumble up on various Drupal performance optimization articles that profess syslog over Drupal's dblog. Problem is, I am a big user of the log exploration interface that comes with the dblog module. For a few years, the first thing in the morning I did at work was to check the Drupal logs from that dblog interface. I love that interface. If I have to abandon dblog for the sake of performance, I want a log search experience just as good as dblog. The first port of call was Drupal.org and this what it says about syslog:
It might not be as user friendly as Database Logging but will allow you to see logs and troubleshoot if your site is not accessible. Because the Database logging module writes logs to the database it can slow down the website. By using Syslog you can improve the performance of the site.
The part where it says "It might not be as user friendly as Database Logging..." is the beast I needed to tame. The most useful feature of the dblog interface is that:
- It lets you filter logs based on log type and severity.
- It lets you keep a maximum of 1000000 (that's 1 million) log entries.
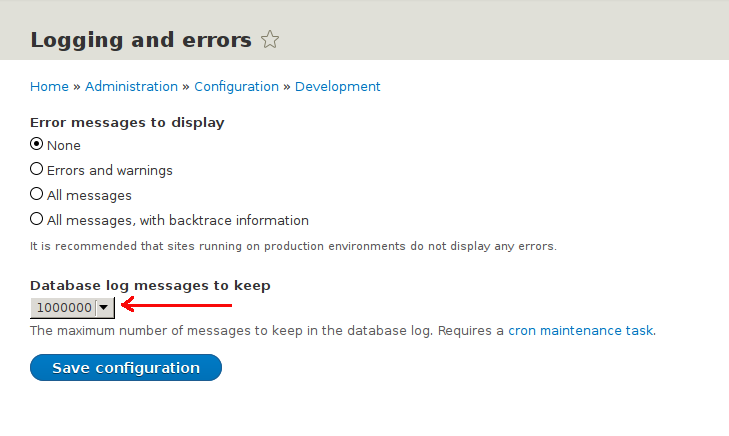
At that point, I failed to imagine my life without both these features. So I wished for something just as good as this while using syslog as the log source instead of the "watchdog" database table. But the search for such a search system proved anything but easy to my surprise. Eventually I settled down on the ELK stack which has ticked all the criterion. It was not easy to setup though. But eventually I made it and in this post I am going to explain how I made it so that you can make it far quicker than I did.
Warning: If you take this path, it will cost you a lot of RAM. A lot of it. 30GB won't hurt.
Alternatives
Any discussion of the ELK stack will drag Graylog onto the stage. To be fair, they are not made for the same task. While both uses Elasticsearch as the data store, Graylog does one thing and one thing well and that is log management. On the other hand, Elasticsearch+Kibana is a generic schema-less data storage and exploration tool. When you throw Logstash into the mix, you get log management which is a subset of its capabilities. I had a difficult time deciding which one to chose. This "Graylog vs ELK stack" Reddit thread greatly worsened my dilemma. Eventually I settled for the ELK stack because all the components come from the same source which according to my dad (in a different context) is a good thing.
I will also take this opportunity to give an honorary mention to that great piece of software called PimpMyLog. It does not tick any of the boxes for me, but the ratio of its functionality vs simplicity is so great that I am highly impressed. If you do not have to deal with multiple servers and tons of logs, do have a look at it before reaching for the big boys. It is so useful that Jeff Geerling has included it in DrupalVM. It also seem to meet most criterion of a successful open source project as set out by Andrey Petrov.
More than one way to do it
The Perl community popularized the phrase There's more than one way to do it (TIMTOWTDI). The different approaches concocted by various well meaning parties attempting to manage Drupal's log using the ELK stack has given this phrase a new life. To date, I have come across at least four ways of doing it:
- Use Filebeat to forward Drupal's syslog entries to the ELK stack. This is the official approach.
- Tell Rsyslog to forward Drupal's logs to Logstash. This is the laziest approach.
- Ask Logstash to grab the log straight out of Drupal's "watchdog" database table.
- Let Drupal send log entries straight to Logstash in the form of JSON. Two Drupal modules have attempted to do this in two different ways - JSONLog and Logstash.
Perplexed by this flood of options, I went for the laziest approach which involves installing and configuring the least number of software. This created the least disturbance in the Force and has worked out well in practice. As you can guess, this is what I am going to explain here.
Server organisation
If you ask yourself "How many servers do I need for the ELK stack?" you will be immediately bitten by the TIMTOWTDI menace. For a start, you will not want to keep Drupal and the ELK stack on the same server. That is only a possibility if you have a really low traffic site. But if you have a low traffic site then you most likely do not even need the ELK stack. How about a single server just for the ELK stack? That is a viable option. It has worked for me. But the true answer lies in the amount of log you want to keep on hand. A single Elasticsearch node (for simplicity's sake, think of it as a single machine) can use at most 30GB of RAM. For best performance, you want all your logs to be in the RAM. So if you are thinking of retaining 100GB of log at all times, you will need at least four Elasticsearch nodes for top performance. Want replication? Throw in a few more nodes. What about Logstash and Kibana? These are fairly lightweight and you can house them in one of the Elasticsearch servers or in a separate server. Who is paying for all those servers? Not me of course. I could find only one server for the ELK stack when it was my turn. The server architecture diagram that follows is based on one server. Just keep in mind that it may not be the ideal solution for you.

Installing the ELK stack
There are a few ways of installing the ELK stack. I like to do it using the package repositories made available by Elastic.co. Yes, Elastic.co maintains their own deb and rpm package repositories and that is what I am referring to. More details:
The only exception is Curator. I had to install it from Python's package repository using pip which also happens to be the officially recommended method.
Configuration
If you have landed here from a search engine, this is the section you are after. Here I describe the configuration for managing Drupal logs using the ELK stack. For ease of understanding (and writing), I have broken the configuration process down into a few smaller sections. Here they come.
Drupal to Syslog
This is the easiest part. Drupal.org has it all explained nice and well, so I will keep it short:
- Enable the syslog module.
- [Optional] Disable the dblog module after you have successfully configured the ELK stack.
In this case, the happy path scenario is that Drupal's log entries should start to show up in /var/log/syslog (at least in Debian). You can ignore them.
Syslog to Logstash
We now need to setup Rsyslog to forward Drupal's log messages to Logstash:
- Drop the configuration snippet from the figure below inside /etc/rsyslog.d/
- Restart Rsyslogd.
#
# @file
#   Setup Drupal log forwarding to Logstash.  Logstash is currently
#   running in 192.168.33.35.  Logstash's syslog input is listening on port
#   5514.
#
# Destination: /etc/rsyslog.d/
#

# Where to place spool files.
$WorkDirectory /var/spool/rsyslog

# Forward Drupal log to Logstash.
# If the remote host is down, messages are queued and sent when it is up again.
$ActionQueueFileName our-drupal-fwd-queue # unique name prefix for spool files
$ActionQueueMaxDiskSpace 1g   # 1gb space limit
$ActionQueueSaveOnShutdown on # save messages to disk on shutdown
$ActionQueueType LinkedList   # run asynchronously
$ActionResumeRetryCount -1    # infinite retries if host is down
local0.* @@192.168.33.35:5514

# Optionally, save log entries in the disk which could be useful in case
# Logstash becomes unavailable.
# local0.* /var/logs/drupal.log
Note the IP address in the configuration snippet. This is where Logstash lives. You may have to change this based on your network topology.
If the syntax of the configuration snippet leaves you puzzled then you are not alone. Luckily, Rsyslog is well documented.
Rsyslog is now the default syslog service of both Debian and Redhat derived distributions. So I am pretending that Syslog-ng does not exist. Pardon me if that offends you.
Logstash to Elasticsearch
When it comes to processing logs, Logstash is to Elasticsearch what our mouth is to our stomach. We break the food in our mouth and pass it to the stomach for further processing. Logstash receives syslog entries, breaks it into fields and passes these fields to Elasticsearch. So Logstash has three functions - receive log, break it, send it to Elasticsearch (or to some other place). This is reflected in its configuration files which also have three sections - Input, Filter, and Output. The following configuration snippet should be enough for processing Drupal's Syslog entries:
#
# @file
#   Sample Logstash configuration file for processing Drupal logs.
#
# You may have to set the timezone name below.  Only zone names are
# accepted; i.e. Europe/London, Pacific/Honolulu, etc.  Numeric timezones,
# i.e. +0100, -1000 are not accepted. ***
#
# Note:
# @timestamp is the timestamp of the event i.e. the time when Logstash
# received the log entry.
# @host is the hostname of the machine that forwarded the log entry to Logstash.
#

input {

  # Logs will be forwarded by rsyslog from web servers running Drupal.
  syslog {
    port => 5514
    type => "syslog"
  }
}

filter {

  # Ignore "Last message repeated N times" messages.
  if [type] == "syslog" and [message] =~ "Last message repeated" {
    # This block has been left blank intentionally.
  }
  # Drupal's log.
  else if [type] == "syslog" and [program] == "drupal" {

    # Set the value of the "type" field.
    mutate {
      replace => {
        "type" => "drupal"
      }
    }

    # If necessary, adjust @timestamp for timezone.  The "syslog" input thinks
    # that all timestamps are in UTC.
    # date {
    #  match => ["timestamp", "MMM  d HH:mm:ss", "MMM dd HH:mm:ss"]
    #
    #  Web server's timezone.  Rsyslog's timestamps are relative to this
    #  timezone.
    #    timezone => "Europe/London"
    # }

    # Extract various parts of a Drupal log line.
    grok {
      match => {
        # Sample Syslog message: http://drupal.dev|1429176247|php|192.162.33.33|http://drupal.dev/foo/bar||1||Notice: Trying to get property of non-object in kartik_preprocess_node() (line 111 of /srv/www/drupal/themes/custom/kartik/kartik.theme).
        "message" => "%{URI:drupal_base_url}\|%{NUMBER:drupal_log_unixtimestamp}\|%{DATA:drupal_log_type}\|%{IPORHOST:drupal_client_ip}\|%{URI:drupal_request_uri}\|%{URI:drupal_referer_uri}?\|%{NUMBER:drupal_userid}\|%{DATA:drupal_page_link}?\|%{GREEDYDATA:drupal_log_msg}"
      }

      add_field => {
        # Drupal can log something at 12:11:30 and that can reach Logstash at
        # 12:11:35.  We want to know exactly when Logstash has received a log
        # entry and from whom.
        "log_received_at"   => "%{@timestamp}"
        "log_received_from" => "%{host}"
      }
    }

    # Set logstash's event timestamp to Drupal log's timestamp.  This way, we
    # will be able to filter log entries in Logstash based on their time of
    # occurance in Drupal.
    date {
      match => [ "drupal_log_unixtimestamp", "UNIX" ]
    }
  }
}

output {
  # Store everything in Elasticsearch.
  elasticsearch {
  }
}
This should go inside /etc/logstash/conf.d/. Do not forget to restart Logstash after adding this file.
You may have noticed a Grok pattern in the configuration file. These are like regular expressions, but far more readable and easier to deal with. If you find yourself tinkering with Grok patterns, there is a great online playground that should not be missed .
I learned a lot about Logstash from The Logstash Book which I found to be a good read. Sadly, it is not available in paper form. I know what you are thinking.
Elasticsearch
Elasticsearch is the grand data store where all the logs will live. For ease of understanding, you can compare it with MySQL. The big difference is that it is schema-less and it is a search engine rather than a database. Its closest competitor is Solr. Like MySQL, it performs better when allocated an abundant of RAM. Its configuration can be very easy or very complicated depending on what you are trying to achieve. It runs as a cluster by default. The smallest cluster has only one node and that, thankfully, is easy to configure:
- Open the configuration file at /etc/elasticsearch/elasticsearch.yml
- Assign a cluster name. Better if the name is meaningful. If you do not assign anything, it will pick up a Marvel comics superhero name. You have been warned.
- Assign a node name. See previous warning.
- Set "bootstrap.mlockall" to true. This setting prevents the operating system from swapping any memory chunk used by Elasticsearch. Swapping is not a happy experience either for humans or Elasticsearch. Try to avoid it at all cost.
- Open /etc/default/elasticsearch (or /etc/sysconfig/elasticsearch in Redhat derived systems).
- Set ES_HEAP_SIZE to whatever amount of RAM you can afford to assign to Elasticsearch. Assign as much as possible, but not more than 30GB. The Elasticsearch reference manual has good advice
- Restart Elasticsearch.
Just Kibana
Kibana lets you explore the data stored in Elasticsearch. Kibana is to Elasticsearch what PHPMyAdmin is to MySQL. To be fair, Kibana is generations ahead of PHPMyAdmin. It can even draw pie charts for you.
Kibana, when running on the same machine as Elasticsearch, does not need any configuration as it comes with reasonable defaults (always a good sign). However, we need to tell it how to search Drupal's logs. This process is very similar to creating Drupal views. You either pick some fields and filters to create a view OR you import an existing view definition. The following definition will do if you are also using the Logstash configuration given above:
[
  {
    "_id": "Drupal",
    "_type": "search",
    "_source": {
      "title": "Drupal",
      "description": "",
      "hits": 0,
      "columns": [
        "severity_label",
        "drupal_log_type",
        "drupal_log_msg",
        "drupal_client_ip",
        "drupal_request_uri",
        "drupal_referer_uri",
        "drupal_userid",
        "host"
      ],
      "sort": [
        "@timestamp",
        "desc"
      ],
      "version": 1,
      "kibanaSavedObjectMeta": {
        "searchSourceJSON": "{\"index\":\"logstash-*\",\"filter\":[],\"highlight\":{\"pre_tags\":[\"@kibana-highlighted-field@\"],\"post_tags\":[\"@/kibana-highlighted-field@\"],\"fields\":{\"*\":{}},\"require_field_match\":false,\"fragment_size\":2147483647}}"
      }
    }
  }
]
Import it from "Settings > Object > Import" as shown below
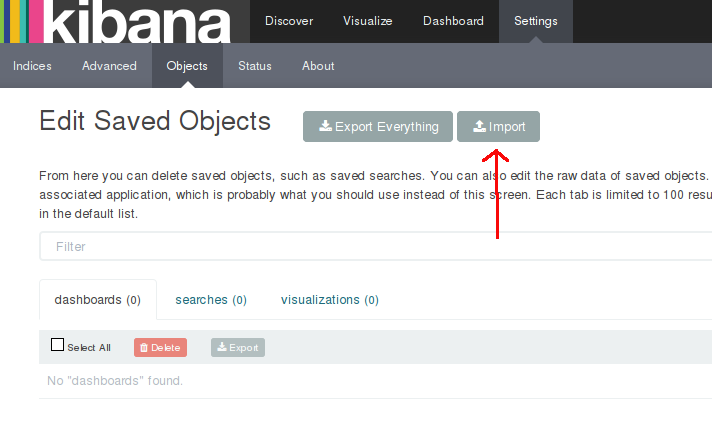
But before importing anything, when you first visit Kibana, you will be greeted with a form that expresses Kibana's bewilderment at not knowing which Elasticsearch indices to use. As we hear quite often, most medicines should not be taken on an empty stomach. Kibana knows it too. Until you have loaded some logs into Elasticsearch, Kibana will not let you go past this form. So make sure Elasticsearch's stomach is not empty before hitting Kibana.
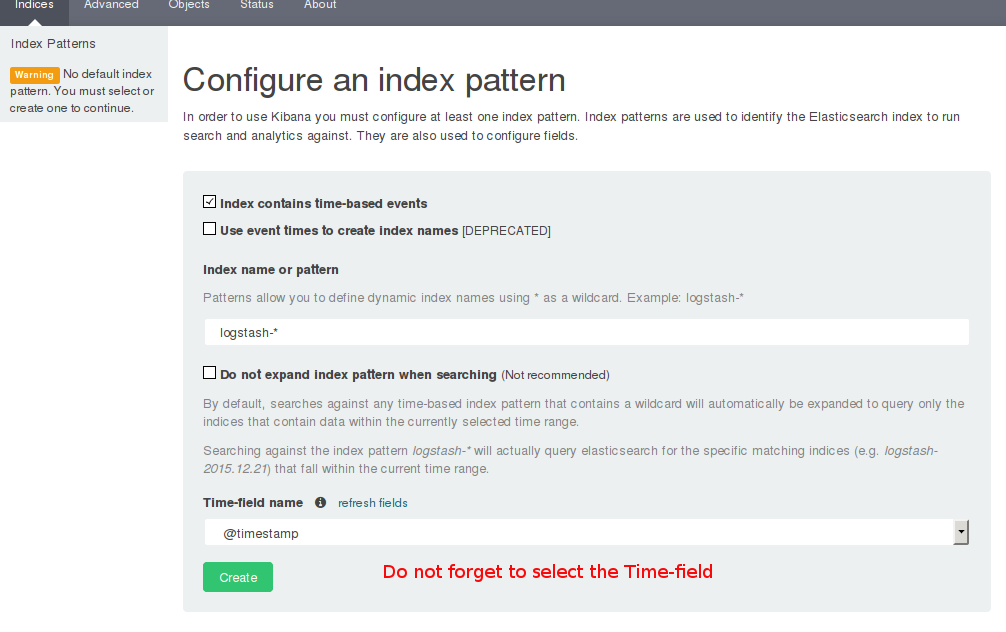
Once Logstash has fed Elasticsearch with some logs, Kibana's initial setup form very helpfully suggests that it be allowed to use the "logstash-*" index pattern. Agree to it, select @timestamp as the Time field name and Kibana should now let you import the search filter. It is a good time to know that Elasticsearch creates one index per day for all the tributes it receives from Logstash. In kindness, it names them in the pattern of logstash-yy.mm.dd. This index name pattern is configurable of course.
Curator
Curator is the youngest member of the ELK family we are going to meet today. It (probably) was born so late that people forgot to include it in the "ELK" acronym. It is like a Swiss army knife, but we are only going to use the delete blade of this knife today. This will allow us to delete older indices from Elasticsearch. It can be invoked as a cronjob. The following command will do:
/usr/local/bin/curator --config /opt/curator-files/curator-config.yml /opt/curator-files/curator-elasticsearch-action-age.yml
The last file (i.e. curator-elasticsearch-action-age.yml) is called the action file which determines what action Curator should take. The following action file will delete all Logstash indices older than 30 days:
---
actions:
  1:
    action: delete_indices
    description: >-
      Delete older Logstash's indices stored in Elasticsearch when an
      index is older than a month.
    options:
      ignore_empty_list: True
      timeout_override:
      continue_if_exception: False
      disable_action: False
    filters:
      - filtertype: pattern
        kind: prefix
        value: logstash-
        exclude: False
      - filtertype: age
        source: name
        direction: older
        timestring: '%Y.%m.%d'
        unit: days
        unit_count: 30
        field:
        stats_result:
        epoch:
        exclude: False
Worried about disk space? It is easy to keep it under control too. The following action file will do:
---
actions:
  1:
    action: delete_indices
    description: >-
      Delete older Logstash indices stored in Elasticsearch when
      the combined size of all Logstash indices is more than 1GB.
    options:
      ignore_empty_list: True
      timeout_override:
      continue_if_exception: False
      disable_action: False
    filters:
      - filtertype: pattern
        kind: prefix
        value: logstash-
        exclude: False
      - filtertype: space
        disk_space: 1
        reverse: True
        use_age: False
        source: name
        timestring: '%Y.%m.%d'
        field:
        stats_result:
        exclude: False
Configuration summary
- Enable Drupal's syslog module.
- Setup log forwarding from Rsyslog to Logstash.
- Setup Drupal log processing in Logstash.
- Import search settings in Kibana.
- If it is a production site, create cronjob(s) for Curator.
- Again, particularly if it is a production site, add necessary firewall rules.
Security
I will not hide the truth for too long. Brace yourself. The out-of-the-box authentication and encryption situation of the ELK stack is not particularly encouraging. While Rsyslog fully supports SSL, Logstash's Syslog input is not ready for that yet. The TCP input can be used as an alternative although that muddies the Logstash configuration a bit. Another solution is to put an SSL-terminated load balancer in front of Logstash. Something like HAProxy or Nginx should do. I must say that I have not tried either.
When it comes to communication between Logstash and Elasticsearch or among Elasticsearch nodes or between Elasticsearch and Kibana, things are no better. The official solution is to install another piece of software called Shield. My poor brain has so far failed to figure out if this Shield is truly open source or not. There seem to be a free-as-in-speech alternative called Search Guard, but I have not tried it yet and so not going to comment on it.
An exception is Kibana which can be accessed over HTTPS connections with little configuration. Authentication is not so simple. You will need either Shield or a web server in front of it doing HTTP authentication. When I put Kibana into production, I restricted access to it using a Firewall.
Whatever you do, make sure you have the right firewall rules:
- Logstash should be only open to Rsyslog.
- When the ELK stack is not in one server, Elasticsearch nodes should be open to their comrades, Logstash, and Kibana only.
- Kibana's web interface, whether or not behind a web proxy, should be restricted too.
Reaching for the cloud
Some of you could be frustrated by the complexity of hosting the ELK stack. Elastic.co has launched a cloud version of Elasticsearch+Kibana which could be easier on the soul. There is a webinar on this which is worth watching. If the length of the webinar (44 minutes) discourages you then you can comfort yourself by telling that the last half is for Q/A only. If you reach for the cloud, you would still have to run Logstash locally and all the configuration files from this page could be useful.
Demonstration with Vagrant
Vagrant o Vagrant, where would I be without you. The truth is, without Vagrant and Ansible, I would not be able to complete this tutorial. So what have I done with Vagrant? I have created a Vagrant project that is going to spin up two Debian 8 instances one of which runs Drupal 8 and another runs the ELK stack. All configuration files are in place. All you have to do is generate some Drupal log and then play with them in Kibana. This, hopefully, will convince you that setting up Drupal, Rsyslog and the ELK stack for managing Drupal's log is worth the trouble. Here are the steps to run the VMs:
- Clone the project from Github
- Optionally, install Ansible in your host machine to speed things up.
- Do
vagrant upfrom inside the project directory. It may take up to an hour on the first run. - Assuming all went well and both the VMs are ready, add their hostnames to the hosts file (i.e. /etc/hosts or its equivalent)
- SSH into the Drupal VM:
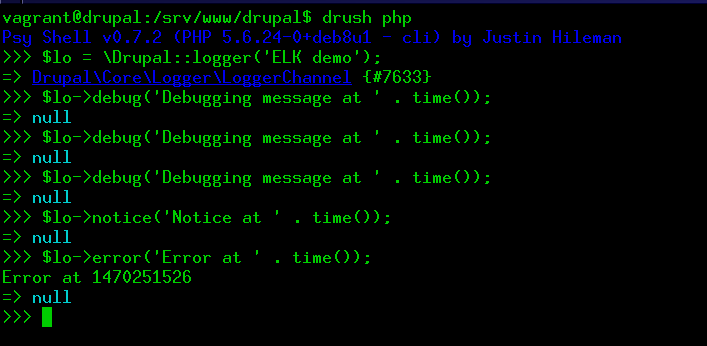
vagrant ssh drupal - From inside /srv/www/drupal/, launch the Drupal REPL and then create some logs. See figure below.
- In your web browser, open Kibana from http://elk.dev:5601/
- Initialize Kibana as explained already.
- Import the search filter from "Settings > Object > Import"
- Open Kibana's Discover tab.
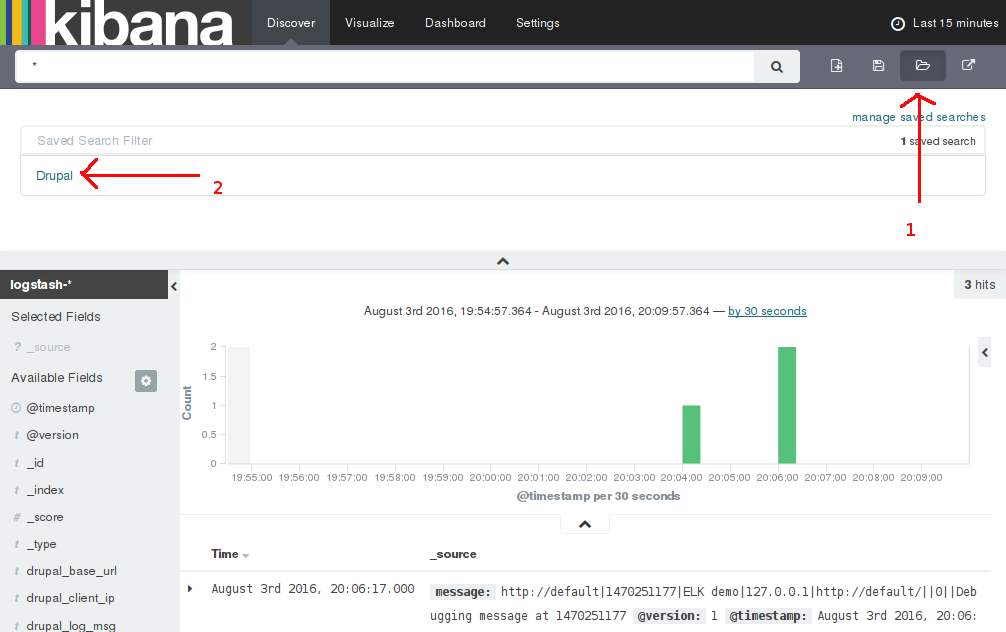
- Open the "Drupal" search filter. See figure below.
- Enjoy exploring the logs.
Searching better in Kibana
The search results for Kibana are prepared by Elasticsearch. Elasticsearch is built on top of Lucene. So the Lucene query syntax works fine in Kibana.
You type your search terms in the large textbox in the "Discover" tab. Here is a sample query: drupal_log_type:user AND severity_label:Notice AND drupal_log_msg:opened. It will return all "user" type log entries of severity "Notice" containing the word "opened". There are many more possibilities. A good place to learn all the tricks is the Kibana reference.
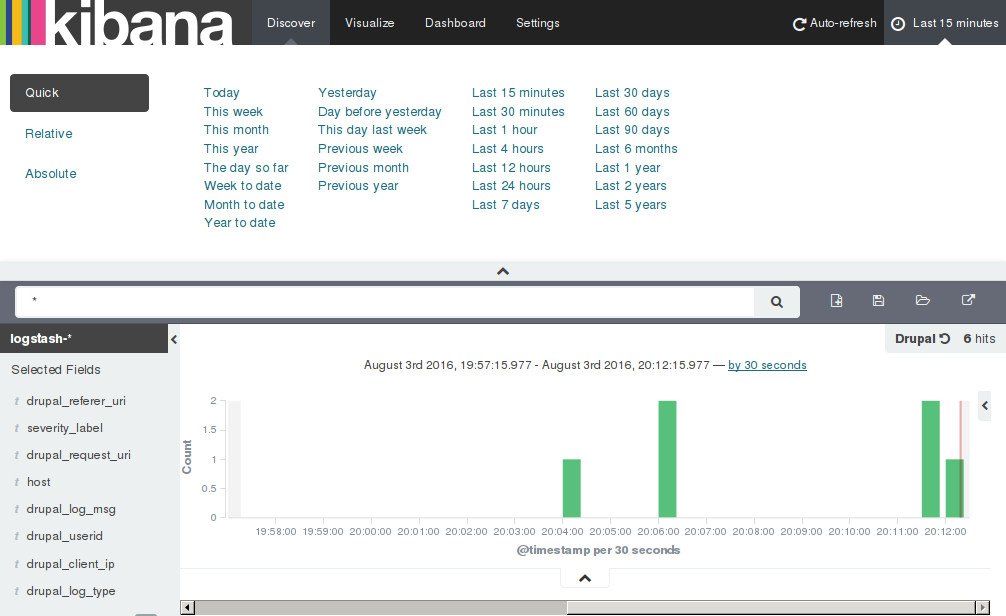
You can also restrict search results within a certain time limit. The default interval is the Last 15 minutes which is visible at the top-right hand corner of the "Discover" tab. Click it to open the interval selector as shown below. This is my favourite feature of Kibana :)
Final thoughts
There is no denying that setting up the ELK stack is not the easiest of things. I have used it for more than a year after going through the initial trouble of setting it up. I have to say that it has mostly paid off. It would have been very difficult to troubleshoot some production bugs without going through nearly month old Drupal and Apache logs held in Elasticsearch. The only trouble came from the lack of RAM in our server which was not really the ELK stack's fault. So I have to say that the ELK stack is stable enough for production use. Those Drupal teams who have the luxury of having their own system administrator or devops should at least consider the ELK stack or similar log management solutions. If you are a small Drupal team working on a big Drupal project, consider your priorities before committing to the ELK stack. But if the Drupal site is not high traffic or very important, I doubt the ELK stack will add much value. So the question of To ELK or Not to ELK comes down to three issues:
- Your team structure.
- How much log you need to retain for how long.
- How important is the log to you.
In this article, I have barely scratched the surface of the ELK universe. The ELK stack is extremely well documented. If you adopt the ELK stack, you will soon find yourself immersed in that sea of documentation. This write up should be considered only a small port on that sea.
August 2016